21 Aug Survey of Consumer Expectations, NFIB Small Business Index, Import Price Index, Household Debt, Retail Sales, Empire State Index, & more…
Survey of Consumer Expectations
A monthly survey conducted on consumer expectations showed a notable pessimistic trend in the month of July. The New Your Fed’s survey of consumer expectations found declines in one year expectations on earnings growthy, household spending, stock prices, and house prices. Median hone year ahead earnings or wages growth expectations fell from 2.7% in June to 2.4% in July, dropping below its 2.5%-2.7% range since November 2017. The decline was broad based across income groups but largest among those below the age of 40. Median home price change expectations retreated from a recent high of 3.9% reached in June to 3.7% in July. Median household spending growth expectations decreased by 0.1% to 3.2% in July, remaining slightly above its trailing 12 month average of 3%. The median expectation that taxes will go up in the next year, rose for the fifth month straight to 2.2% after the series low of 1.5% in February. Expected growth in government debt increased from 6.6% in June to 6.9% in July, well above the 4.9% median year ahead growth forecast reported July 2017. Even with this pessimistic shift in directions, it should be noted that consumers by and large are still fairly upbeat. Unemployment expectations are near the series low, the perceived probability of losing one’s job in the next 12 months fell to 14% from 15.2% and the probability of leaving one’s job voluntarily increased to 23.2%, near the series high.
NFIB Small Business Index
The national Federation of Independent Business small business optimism index rose 0.7 points in July to 107.9. This was the second highest level in history and just under the 1983 peak. Eight of the ten components, led by plans to increase employments, expectations for rising sales and for expansion, increased; those for current inventories and plans to increase inventories declined. The single most important issue flagged by small businesses were the concerns about the quality of labor, with a net 23% saying no.
Import Price Index
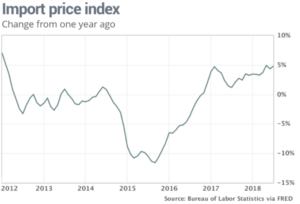
The cost of imported goods was flat in July but the yearly rate jumped to the highest level in six and a half years. The import price index was unchanged in July; excluding fuel, import priced dropped 0.3% last month. The rate of import inflation over the past 12 months, however, did climb to 4.8% for the highest rate since February 2012. With fuel omitted, the increase was a much smaller and more manageable 1.3%. Still, it was negative just a few years ago. The cost of imported oil rose again in July, though by a smaller amount compared to the spring. The rise in energy prices was more than offset than falling costs of industrial supplies, capital goods, food and drinks. Similarly, the price of some export5s such as soybeans appeared to fall as suppliers sought to sell them quickly before US or retaliatory tariffs took effect. The US has sanctioned China and other trading partners who’ve responded in kind. US exports sank 0.52% in July, or the biggest decline in more than a year. Soybean prices tumbled 14%. Inflation has surged over the past year, though from very low levels. Higher oil prices have been the main culprit so far, but tariffs imposed by the Trump White House could add to the costs unless a horde of simmering trade disputes are soon resolved.
Household Debt
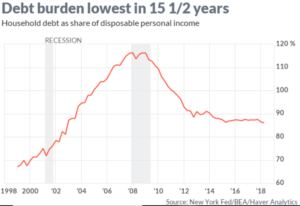
The debt burden of US households is the smallest it’s been in nearly 16 years. Household debt- including mortgages, credit cards, auto loans, student loans, and other credit- grew for the 16th consecutive quarter in the April to June period, rising by 0.6% or $82 billion, to 13.29 trillion. With personal disposable incomes at a $15.46 trillion annual rate in the quarter, the debt to income ratio dipped to 86%. That is the lowest, by only a small amount, since the fourth quarter of 2002. At the height of the credit bubble in 2008, debts topped 116% of disposable income. Seriously delinquent debt stayed at 2.3% in the second quarter in some encouraging news. Those numbers reached as high as 7.9% during the recession and have gradually drifted downward.
Retail Sales
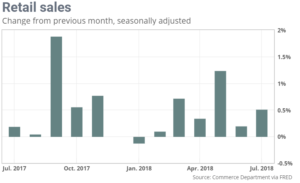
US retail sales rose a healthy 0.5% in July, showing the economy still has plenty of punch left at midsummer. Although the increase exceeded the 0.1% forecast, the government also said sales in June rose a smaller 0.2% instead of the 0.5% as originally reported. Sales were fairly robust in July even if gas stations and auto dealers are exclude Without these two components retail sales rose 0.6%. Retail sales have increased 6.4% over the past 12 months, close to the long run average since 1980. Clothing stores and restaurants posted a 1.3% increase in sales to lead the way. Sales also rose 1.2% for department stores and 0.8% for both Internet retailers and gas stations. Auto receipts edged up 0.2% even thought the industry itself previously reported a decline in unit sales. Sales fell for home furnishings, pharmacies and stores that sell sporting goods and other hobby style items such as books and music. The USA economy is sailing along midway through 2018 despite ongoing trade spats with key trading partners such as China. The threat of a financial crisis in Turkey has spawned fresh worries but so far, the damage has not spread much beyond the country’s borders. The US appears on track to reach or exceed 3% growth in 2018 for the first time in 13 years, but if the trade disputes worsen all bets are off. The Fed is also raising interest ratees and that could also dampen growth in key segments of the economy such as real estate that are sensitive to changes in the cost of borrowing. The July retail sales report indicates that the momentum heading into the third quarter remains solid, which bodes well for consumer demand and overall economic strength.
Empire State Index
The Empire State manufacturing index rose 3 points to 25.6 in August, to the highest level in ten months. Economists had expected a reading of only 20. Any reading above zero indicates improving conditions. The new orders index was little changed in August, falling 1.1 points to17.1 while the shipments gauge jumped 11.1 points to 25.7. Delivery times continued to lengthen, and unfilled orders rose. Price indexes remained elevated, indicating “ongoing price increases. Firms remained upbeat about the six-month outlook, but less so than earlier in the year. The Empire state index has been holding up well in face of trade headwinds. The index is the first of several regional manufacturing sentiment gauges to be released. The Empire data suggests a slight increase in the August ISM manufacturing index. The trend has peaked, but the index remains at a very high level and is not trending down. That will change, thought if administration imposes its threatened tariffs on a wide range of imports from China.
Productivity /Unit Labor Costs
The productivity of American businesses surged to a 2.9% annual pace in the second quarter, reflecting the biggest gain in more than three years. Companies boosted output more than twice as much as the increase in hours workers spent on the job. That helped to keep labor costs down despite an ultra tight labor market. Output or goods and services produced, leaped 4.8% for the biggest increase in almost four years. The amount of time employees worked rose 1.69%. Productivity is determined by the difference between output (4.8%) and hours worked (1.9%). The surprisingly strong improvement in productivity helped companies to keep labor costs under control despite a falling unemployment rate and the tightest jobs market in decades. Unit labor costs or the price to make each product, fell by 0.9%. Over the past four quarters unit labor costs have risen just 1.9%. Productivity has been low for years but there is some hope it could increase in the near future. The Trump administration ibn 2017 pushed through the biggest package of corporate tax breaks in more than 30 years and its been cutting regulations in an effort to spur businesses to invest more. Higher investment is what generates increased productivity, the key to a higher standard of living.
Industrial Production/ Capacity Utilization
Industrial production rose a slim 0.1%in July, as rising manufacturing outputs offset declines from mining and utilities usage. This is down from gains averaging 0.5% over the previous five months. The gain was below expectations of a 0.3% increase. Over the past year, industrial production is up 4.2%, the strongest gain in more than six years. Capacity utilization stayed at 78.1% in July, around the range it’s held for the last five months. In July manufacturing output rose 0.3% after a 0.8% gain in the month prior. The output of mining declined 0.3% the first drop in six months. Helped by a recovery i9n oil prices, mining output was nearly 13% higher than 12 months ago. The output of utilities fell 0.5%, the third straight decline. The production of autos and auto parts rose 0.9% is down from a 7.6% gain in June. Manufacturing activity has gained momentum since the beginning of 2017. The modest gain in July could be a sign of the plateauing housing sector and rising trade restrictions. Overall, given that there was a big upward revision to June and that some of the disappointment in July reflected the volatile utilities area, this is a solid set of figures that points to continued momentum for the US industrial sector at the start of the third quarter.
Home Builders’ Index
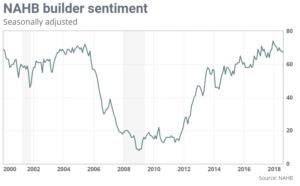
The National Association of Home Builders’ monthly confidence index ticked down one point to 67 in August. The closely watched tracker of builder sentiment has been moving down since ay. In a release he reading of 67 was considered solid but it lags from the 2017 full year average of 68. Economists had forecasted a flat reading. The index’s two sub gauges, which measure attitude about the current pace of sales and expected sales over the coming six months, each ticked down one point, to 73 and 72. The trracker5 of buy traffic fell two points to 49. Any readings over 50 signals improving conditions. Builders continue to monitor how tariffs and the growing threat of a trade war are affecting key building material prices. For the past five years, the homebuilder survey has been a much better indicator of direction of housing starts than their level, whereas for decades before it was a reliable signal of both. Buyer demand is firm, but builder supply has waned.
Weekly Jobless Claims
Initial jobless claims, a measure of layoffs in the US, fell in early August and returned near a post recession low. New claims declined by 2,000 to 212,000 in the seven days from August 5th to August 11th. Economists had forecasted a reading of 215,000. The more stable monthly average claims slipped by 1,000 to 215,500. The number of people already collecting unemployment benefits dripped by 39,000 to 1.72 million, otherwise known as continuing claims. The number of applications for jobless benefits in early August was just slightly higher than a post-recession low set in April. Earlier this year the rat of layoff dropped to levels las seen I the late 1960’s. Millions of new jobs have been created since 2010, putting more money in Americans’ pockets and pumping more cash into the economy. Forecasters predict the US will expand at a 3% plus pace I the third quarter to follow up the spring’s rate of growth of 4.1%.
Housing Starts
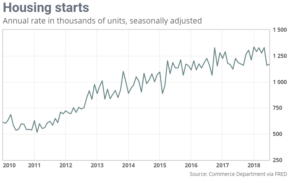
Construction on new houses increased by less than 1% in July, reflecting a recent slowdown in building that’s likely tied to higher mortgage rates and growing shortages of skilled craftsmen. Housing starts edged up to an annual rate of 1.17 million last month from a revised 1.16 million in June. Economists polled had expected start to reach a total of 1.27 million. Permits to build new houses, meanwhile, rose 1.5% to 1.31 million annual pace. While that is still healthy, permits have also fallen off a recent post recession peak. The number of housing starts in July, however, was 1.4% lower compared to 2017.
Home Builder Sentiment
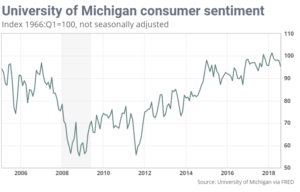
The consumer sentiment index in August fell to 95.3 down from 97.9 in July, the lowest in 11 months. Economists polled expected a slightly higher reading of 98.5. The decline was concentrated among households at the bottom third of the income distribution; with the concern being rising prices. Buying conditions for large household durable which include items such as furniture, cars, and appliances, sank to the lowest level in nearly four years, and vehicles in particular had the worst reading in the past four years. This is the first time in a while where perceptions of inflation really impacted the report. That said, the one-year anticipated inflation rate stayed at 2.9%. While current conditions dropped sharply, the index of consumer expectations stayed at 97.3, perhaps as the unemployment rate was just 3.9% in July.

