24 Sep CCL Market Update: Empire State Index, Home Builders’ Index, Housing Starts/ Building Permits, Weekly Jobless Claims, and More…
Empire State Index
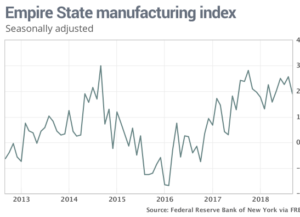
Factories in the New York region of the US churned out goods at a slower but still prosperous pace in September. The Empire State manufacturing index fell to 19 points in September from a 25.6 reading in August, which was a 10-month high. Economists had forecasted the index to come in at 23 points. The index for new orders slipped 0.6 points to 16.5 and the shipments index dropped 11.4 points to 14.3. A measure of what it costs to buy raw and partly finished goods inched up to 46.3 from 45.2. This reflects the upward pressure on a variety of materials firms need to produce their goods. Manufacturers remained optimistic about future growth, though a little less so than in the recent past months. The index measuring expectations six moths from now dropped to 30.3 from 34.8. The index is the first of several regional manufacturing surveys released on a monthly basis. They are known to be volatile but when all reports from the different regions are put together they do present one of the timeliest reads on a critically important part of the economy. The US economy is still booming, growth surged in the spring and has carried through the summer. Like most other companies, manufacturers say one of their biggest problems is finding enough skilled workers to fill a high number of job openings. Many companies say they plan to add more workers or increase hours for current employees, and in some cases even raising wages. US tariffs and foreign retaliatory measures, on the other hand, has made it harder to obtain a steady source of supplies at reasonable prices. Higher labor and material costs could cut profits or force companies to pass on price increases to customers. Though economists’ core view remains that the rate of growth of output likely has peaked for this cycle, however there is no evidence that a real slowdown is underway.
Home Builders’ Index
The National Association of Home Builders’ monthly confidence index was unchanged at 67 in the month of September. Builder sentiment matched the forecasts of economists which had called for a flat reading in the month. The index is at a solid level but is a full po9int below the full year average of 2017, and matches the low mark for 2018, this is a signal that homebuilding recovery may have run out of steam. The components of the index were mixed. The measure of current sales conditions rose one point to 74 while the expectations for the next six months component increased two points to 74 as well. The sub-index which tracks buyer traffic saw no change remaining at a level of 49. Readings above 50 signal improving conditions. Housing affordability is becoming a challenge as builders face overly burdensome regulation and rising material costs. The sentiment index is closely watched for clues on whether builders will start more housing projects. The forecast is for a pace of 1.243 million homes newly constructed homes to be built, which is up nearly 0.1% from July. Mortgage demand popped up in August, so we can expect a modest, yet most likely temporary, one-point uptick in the index to a level of 68. The underlying trend, however, is that the index is slowly decaying.
Housing Starts/ Building Permits
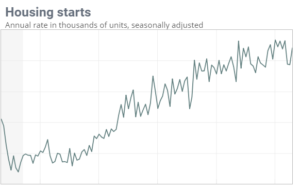
Housing starts ran at a 1.282 million seasonally adjusted annual rate in August. That was 9.2% higher than July’s pace and 9.4% higher than a year ago. Home builders’ broke ground on new homes in August in what is good news for the housing market that has been in great need of supply. The pace of housing starts in August beat economists’ predictions of 1.249 million. The applications for new homes, however, decreased to a rate of 1.229 million pace of permits in August was down 5.7% for the month and 5.5% from a year ago. August’s pace of permits was the lowest since May of 2017. Builder sentiment is unchanged in September, strong consumer demand is offset by high input costs and the newly implemented tariffs are not helping. The government’s new home reports are based on only small samples and therefore can be subject to large revisions. Year to date starts are up 6.9%. In August, single family home starts edged up slightly: they were 1.9% higher in the month. Single family permits, the metric most critical to understanding builder permits, decreased 6.1%. Generally speaking, most single-family houses are built for purchase rather than rent, and therefore, economists view an activity increase in the building area a sign of a stronger economy and healthy consumers. Permits have faded from their cycle high of 1.38 million set back in March of this year. This suggests that starts are likely to remainder of the year. This is consistent with economists’ expectations of residential construction being an overall wash on economic growth at this stage of the cycle. Industry sources suggest the price appreciation in recent years has finally reached a point where prospective buyers are becoming hesitant when purchasing a home. Additionally, high end homes in high tax states are beginning to see the effect of tax law changes implemented last December. Furthermore, new home construction has been impacted by a run up in materials costs this year. This is negatively impacting builders, as home building prices increase, and the appetite of prospective buyers dry up.
Weekly Jobless Claims
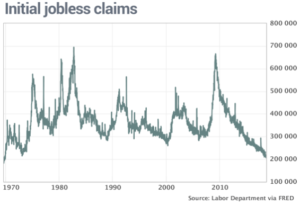
The number of Americans who applied for unemployment benefits in mid-September fell to a new 49-year low, in part because of Hurricane Florence but mostly due to a surging economy. Initial jobless claims is a rough estimate of layoffs, fell by 3,000 to 201,000 in the week ending in September 15th. This is below economists forecasts of 208,000 and is the lowest level since the week of November 12, 1969. The monthly average of new claims slipped 2,2250 to 205,750 also a 49 year low. People already collecting unemployment benefits, known as continuing claims, declined by 55,000 to 1.65 million. This is the lowest level they have been at since 1973. The storm surge caused by Hurricane Florence helped to contribute to the low level of claims last week as applications in the Carolinas fell by an unusually large number, indicating that fewer people filed for claims due to government office closures and the lack of power. Layoffs in the US have been falling steadily for eight years and could soon drop below 200,000 for the first time in 50 years. The comparison between now and 50 years ago, are not the same; rules for determining who is eligible for benefits has changed over time as the nature of the US labor force is much different than it was in the late 1960’s, when the size of the US population was much smaller. By any measure layoffs in the US are extremely low. The US economy sped up in the spring and sailed through the summer and as it heads into fall it continues to run on plenty of steam. Record job openings, strong hiring, low unemployment, and rising incomes are likely to keep the economy strong even with the Federal Reserve expected to raise interest rates yet again in their next meeting.
Philly Fed Index
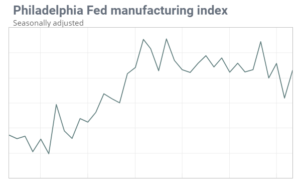
The Philadelphia Fed manufacturing index rebounded after slowing sharply in the month prior. The index rose to a two-month high of 22.9 in September from 11.9 in August. The September level was above economists’ expectations of 19.6. Any reading above zero indicates improving conditions. The new orders index jumped 11.5 points to 21.4 while the shipments index rose 3 points to 19.6. Respondents to the survey reported diminishing price pressures. Expectations for the next six months showed some moderation. The index returned to near its average reading for the year. The Empire State factory index, discussed above, fell by 6.6 points to 19 in September for a softer than expected reading. These two regional manufacturing reports are of particular interest to traders primarily because they are seen as an early forecast for the national Institute for Supply Management factory Survey due two weeks from now. These mixed readings in the two reports could mean a retreat for the ISM factory index in September after hitting a 14-year high last month in August. It is believed that the business surveys are peaking but a rapid decline is not expected. The cyclical downshift is most likely still some way off, thought the imposition of the wider tariffs on Chinese imports and the threat of more to come is creating uncertainty in the outlook.
Existing Homes Sales
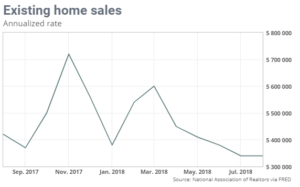
Existing home sales ran at a seasonally adjusted annual rate of 5.34 million in August, which his unchanged from July. After falling for four straight months sales of previously owned homes stabilized in August. Existing home sales were 1.5% lower than they were a year ago. Although sales have seemed to be stagnant this year, the year to date is only 1.2% lower than this same period a year ago. The flat reading missed economists’ forecasts of a 5.37 million rate. Sales surged 7.6% in the Northeast and rose 2.4% in the Midwest, while the South decreased 0.4% and the priciest area, the West, sales slumped 5.9%. The housing market seems to be going in the direction of equilibrium. Prices are still rising but at a slightly lower pace. Buyer reluctance may have helped to increase inventory a notch for its first increase in nearly three years, as it rose 2.7% from a year ago, price gains moderated to a 4.6% yearly increase. This was the fourth month of sub 5% yearly price growth and left the national median price ay $264,800. At the current pace of sales, it would take 4.3 months to sell all available inventory. The increased inventory in August was gladly welcomed, the August results were referred to as steady, but it was noted that the 4.6% annual gain in prices still outpaced wages.
Leading Economic Indicators
The nine-year-old US expansion is set for a 3% growth rate in the second half of the year according to an index that measures the nation’s economic health. The leading economic index rose 0.4% in August following even stronger gains in the prior two months. The LEI is a gauge of the 10 indicators meant to signal peaks and valleys in the business cycle and the broader economy. Most of the components tracked expanded last months, pointing to a 3% or more growth rate in gross domestic product in the final two quarters of this year. The booming US economy expanded at a very solid 4.2% pace in the spring and is forecasted to grow at least at a 3% growth rate based on most of the recent market forecasts. The leading indicators are consistent with a solid growth scenario in the second half of 2018 and at this stage of the maturing business cycle in the US, it doesn’t get much better. The strengths among the LEI’s component were very widespread and further supported an outlook of a level above 3.0% growth for the remainder of 2018.

