
05 Sep Chicago National Activity Index, Advance Trade in Goods, Case-Shiller HPI, Consumer Confidence Index, Gross Domestic Product Revision, Pending Home Sales, Weekly Jobless Claims, Personal Income/ Consumer Spending/ Core Inflation, Consumer Sentiment Index
Chicago National Activity Index
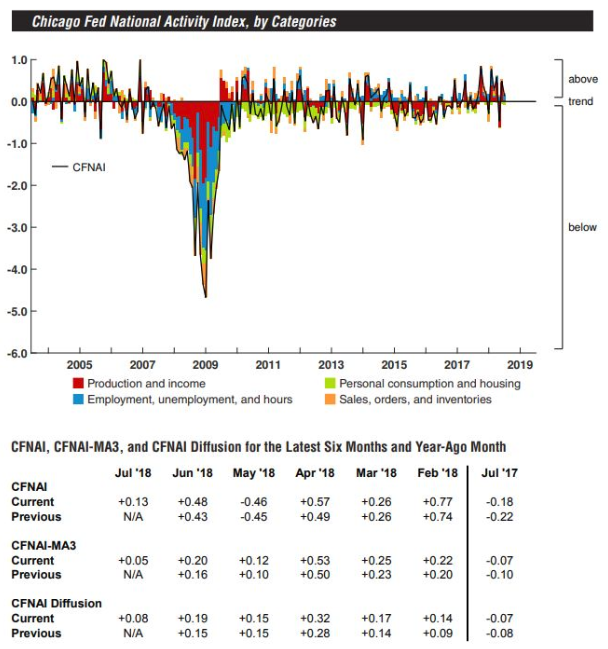
A measure of the US economy from the Chicago Federal Reserve slowed in July from June’s robust performance, owed in large part to lighter output at the nation’s factories. The Chicago Fed’s index of national economic activity registered at a positive 0.13 last month, down from an upwardly revised positive 0.48 in June. The less volatile, three month moving average edged down to positive 0.05 in July from an upwardly revised positive 0.20 in June. The Chicago Fed index is a weighted average of 85 economic indicators designed so that zero represents trend growth and three-month average below negative 0.70 suggests a recession is underway. Thirty six of the 85 individual indicators made positive contributions in July, while 49 made negative contributions. Thirty-four indicators did improve from June to July, while 51 indicators deteriorated. Production related indicators, or factories, contributed a positive 0.05 in July, own sharply from a positive 0.45 in June. This reading reflects the results of the latest industrial production report from The Fed and the Institute for Supply Management’s new orders index which decreased to 60.2 from 63.5 in June. The contribution of personal consumption and housing category was a negative 0.07 in July from a negative 0.06 in June. New home sales dropped to a nine month low as the housing market begins to wobble. The employment related indicators on the other hand, contributed positive 0.12 to the Chicago Fed National index in July up from 0.03 in June. The Labor Department data revealed earlier in the month revealed unemployment rates ticked even further down to 3.9% in July from 4% in June.
Advance Trade in Goods
An early look at trade patterns for the month of July showed a widening in the nation’s trade deficit to the highest level in five months, a sign that perhaps the growth will slow down a little in the third quarter from its rapid pace in the second quarter, April-June. The trade gap in goods, excluding services, rose 6.3% to $72.2 billion from a revised $67.9 billion in June. This is the highest rate since February. Economists had predicted a deficit to widen, but not at the pace recorded as they predicted a $69.4 billion deficit for the month of July. The size of the trade deficit is tied to changes in exports and imports of goods. Services do not change much on a monthly basis. The advanced look at wholesale inventories estimated a 0.7% increase in July and retail inventories were estimated to increase by 0.4%. There was a widespread reduction in exports in July, falling for the second month in a row. Exports of capital goods and consumer goods helped to pace the month’s losses. Gains in imports were across the board, at the same time, with the only monthly drop for consumer goods. The trade gap is about 7% wider than this time last year in 2017. A strong US economy is drawing in imports , while the global economy has softened from its strong start in the year. Exports are also being held down by the rising dollar. The decline in exports could be due in some part to the retaliation on US goods from the Trump administration tough global trade negotiation stance.
Case-Shiller HPI
The S&P/Case-Shiller national index rose a seasonally adjusted 0.3% and was up 6.2% for the year in June. The 20-city index rose a seasonally adjusted 0.1% and was up 6.3% compared to one year ago. Economists and housing watcher have said for years that prices couldn’t continue growing as fast as they were. The market finally got this message as price growth began decelerating, prices are not declining: the national index had a 6.2% annual gain it was down from 6.4% in the three month period ending in May. The 20 city’s annual gain was also down two ticks from 6.5%. This is still double the rate of inflation and wage gains, but is a step in the right direction for bringing the market back in reach of more buyers.

Consumer Confidence Index
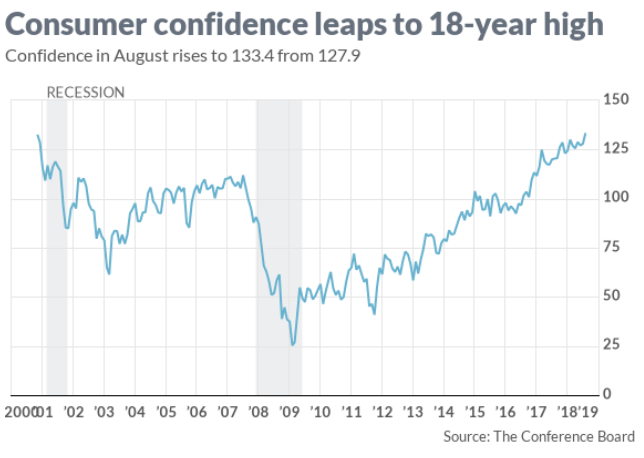
Consumer confidence in the US soared in August to an 18-year high and hit a seldomly reached peaks, reflecting the surge in the economy’s growth as well as the lowest unemployment rate in almost two decades. The consumer confidence index jumped to 133.47 from a revised 127.9 in July. This is the highest its been since October 2000 and beats the previous post-recession peak of 130 set back in February. The only other period in which consumer confidence was higher was during the internet-fueled boom between the years of 1997 to 2000, based on the official monthly readings that date back to 1977. The index was also higher in the mid 1960’s but the survey was only conducted every two months during this time. The present situation index is a measure of the current conditions of the economy, it climbed to 172.2 from 166.1. This is also the highest level since 2000. The future expectations index advanced to 107.6 from 102.4. Americans have rarely felt this good about the economy. Millions of people have found work, layoffs have fallen to levels last seen in the late 1960’s, incomes are rising, and businesses are investing. The US economy expanded at a pace of 4.1 in the second quarter of the year on an annual basis. Overall, these historically high confidence levels should continue to support healthy consumer spending in the near term.
Gross Domestic Product Revision
The strong US economy was even stronger in the spring than what was initially reported due to the higher government spending and business investments. Gross domestic product expanded at a 4.2% annual pace in the second quarter up from the preliminary estimate of 4.1%. GDP is the official measure for the US economy. Economists had forecasted GDP to remain unchanged at 4.1%. This strong growth, along with the biggest tax cuts in 31 years helped to fill the corporate assets. Adjusted corporate profits before taxes climbed up 3.3% in the second quarter and they were up on a yearly 7.7%. This is the biggest 12 month gain in four years. Consumer spending remained strong in the second quarter, but a little less than what economists predicted. The government said outlays rose 3.8% rather than the 4% predicted. Businesses investment was stronger, contributing to the overall growth rather than subtracting from it as firms spent more on software and equipment. The value of the sold goods or what is known as inventories remained to still be a drag on the second quarter growth., they fell at a revised $27 billion rate. Exports rose a slightly revised 9.1% annual clip, though the government said imports fell at a 0.4% rate instead of increasing. The smaller trade deficit added to the strong GDP, though this is unlikely to last. Government spending advanced 2.3% instead of predicted 2.1%; reflecting higher spending on the military. The rate of inflation was moved up to a 1.96% annual pace from 1.8%. Most other GDP figures were little changed. The economy hasn’t been this strong since the early 2000’s. The US may top 3% growth in 2018 for the first time since 2005, with its higher incomes, strong hiring, falling unemployment and rising business investment. Americans are increasingly showing their optimism in the economy. Consumer confidence rose in August to the highest level in 18 years and reached a peak only matched a few other times in this half century. A 4% growth though is not to be expected, as early signs point to the trade deficit widening and that’s a negative for GDP. Consumer spending rarely rises at such a high rate two quarters in a row. The US has averaged just 2% annual growth during the current nine year expansion, most economists contend that the GDP can not expand much faster than that because of low productivity and slower increase in the population, the two most critical launching pads for growth. The bottom line being that the economy remains on a path of solid growth and appears to have the potential to remain on a positive track for some time to come.
Pending Home Sales
Pending home sales declined 0.7% in July, the National Association of Realtors reported. The index for pending home sales tracks real estate transactions in which a contract has been signed but the transaction has yet to close. This index fell to a reading of 106.2, missing economists forecasts of a flat unchanged reading. This is the seventh straight month in which the index was lower on an annual basis, by 12.3% in July. In the first eight months of 2018 so far, the index has charted monthly increases four times and monthly decreases four times. Housing has stalled in July, as total home sales both existing and new to the lowest point in six years. In what has been as seller’s market across most of the US hitting a tipping point this year, as buyers decided the slim inventory of houses on the market are not worth it. The pending sales data is frequently considered to be an early read on the important existing home sale reports, since contract signing precede closing by several weeks. In the recent years, this relationship has broken down a bit but the big picture remains the same: a market starved for supply isn’t conducive to healthy momentum. Realtors forecast a full year decline for existing home sales in 2018, and only a 2% increase in 2019. It appears sales activity peaked late last year in 2017, affordability constraints have helped to cool the housing market especially in expensive market areas. Many metro areas are desperately needing more new and existing inventory to break out of this slump.
Weekly Jobless Claims
The already small number of Americans applying for unemployment benefits each week reached a new bottom in late August that was the lowest level since 1969. Initial jobless claims, a tracker for layoffs, rose by 3,000 to 213,000 in the week of August 19-25. Economists had forecasted a slightly lower reading of 212,000. More notably, the average of claims fell by 1,500 to 212,250, the lowest level since December 1969. The number of people collecting unemployment benefits already of “continuing” claims, dropped 20,000 to 1.71 million. The rate of layoffs has been declining for years and are now at the lowest levels in half of a century. Many companies say it is hard to find skilled labor they are reluctant to cut any jobs even when business is slow. The US economy is on track for another strong stretch of growth in the third quarter which began the first of July. Economists forecast 3% growth after an impressive 4.2% increase in the spring. The Federal Reserve is likely to raise interest rates again in September and make it more expensive to borrow money, but this is unlikely to dampen growth. Current claims levels continue to reflect a labor market that is very tight.
Personal Income/ Consumer Spending/ Core Inflation
Consumer spending rose sharply in July for the fifth month in a row, getting the economy off to a good start for the third quarter. The strong economy has pushed a key inflation barometer to a six year high assuring interest rates will soon rise. The government said consumer spending increased 0.4% in July matching economists production; while incomes rose 0.3%. Higher spending and faster economic growth have also helped to fuel increasing inflation amid a growing shortage of labor and rising costs for raw materials. The 12month increase in the PCE index, the preferred inflation gauge for the Federal Reserve, rose to 2.3% from 2.2%. This is the highest level it has been at since April 2012.0 Consumer spending has increased by 0.4% or higher in every month since March. In July, Americans spent more on hotels, eating out, and prescription drugs. The savings rate fell a tick to 6.7% from 6.8% as spending outpaced incomes. The savings rate had been as high as 7.4% this year. The PCE inflation index fell 0.1% in July. The rate increased 0.2%. Consumers helped to turbo charge the economy in the spring, when gross domestic product surged 4.2% and economists predict GDP will increase by at least 3%% in the third quarter. Consumer have by far the biggest influence on the economy, unemployment is low and falling further, incomes rate rising and the stock markets have roared back to record or near record highs. Consumer confidence has recently rose to an 18 year peak. The downside to this growing economy is steadily increasing inflation. The Fed is raising interest rates in attempt to prevent the economy from overheating, but that means Americans will have to pay more to borrow money to buy new homes and cars. These improving household finances are being fueled by the solid gains in wage growth and lower personal tax rates will help to bolster consumer spending for the next several quarters.
Consumer Sentiment Index
The consumer sentiment index was revised slightly higher in its final August estimate but remained at the lowest reading of the year. The index was 96.2 in August, below July’s level of 97.9. The preliminary reading was 95.3, economists predicted a final reading of 95.5. Most of the August decline was in the current economic conditions index, which fell to the lowest reading in almost two years. The worsening conditions came despite the strong gross domestic product. The causes of the decline were: less favorable assessments of buying conditions, which were caused by worries about prices and rising interest rates. Inflation expectation for the next year rose to 3.0% form 2.9% in July while expectations for the next year rise to 3.0% from 2.9% in July, the highest reading in four years. Sentiments is still trending higher and economists don’t expect material slowdown in consumer spending. The survey may be capturing concerns of higher inflation and uncertainty regarding tariffs. While conumer4 sentiment was down on concerns over affordability, higher aftertax income, a strong labor market, and above trend growth continue to anchor attitudes.